Geographer's Space
A Louisiana Forte
Lower Louisiana, where elevations may vary only by inches over miles, provides a unique challenge to mapmakers
Published: June 1, 2017
Last Updated: October 30, 2018
One might surmise that this nation’s most challenging topographic mapping project entailed surveying the Western wildlands. But what made that task difficult was the terrain’s immensity and inaccessibility; its ruggedness, on the other hand, made it rather clear what was up or down and by how much. Surveyors and cartographers had plenty of raw material to work with.
Not so lower Louisiana, where elevations may vary only by inches over miles, where no natural landmarks stand salient, and where it’s sometimes debatable exactly where land becomes water. Our region presented a particularly challenging environment to topographic mapmakers, and unlike most other areas, the project here is ongoing, because our elevations are constantly, and dangerously, in flux.
Elevations in Louisiana were initially mapped using traditional land-surveying techniques, including traverse lines, leveling, and triangulation. Surveyors worked within a framework of relativity, enabling them to measure, for instance, how much higher a river bank arose above its backswamp, or how much lower was Congo Square than Jackson Square. To connect these spatial relationships to regional and national elevations, cartographers had to reconcile them with an agreed-upon baseline, known as a vertical datum.
Today we think of that datum being sea level, but this was a long time coming. Early surveys throughout the Mississippi Valley were initially based on arcane regional baselines, such as the level of a Memphis-area flood in 1858, or the Cairo City Datum of 1871. Such cartographic regionalism reflected the relatively weak federal government of this era, not to mention the sheer difficulty of the mapping task and the enormity of the growing nation.
As federal authority expanded and mapping technology advanced, so too did the realm of vertical datums. Starting in 1879, the newly formed Mississippi River Commission began to integrate the old regional datums to form the New Memphis Datum of 1880. The following year, the Commission began associating this standard with the level of the Gulf of Mexico at Biloxi, creating, by 1899, a Mean Gulf Level Datum to which surveying benchmarks would be referenced.
As a result of these changing standards, old Louisiana elevation maps must be interpreted with care. One 1895 elevation map, for example, measured the French Quarter riverfront at a rather lofty 35 feet, much higher than today. But that figure implied 35 feet above the Cairo Datum, not above sea level. The Cairo Datum was known to be 21.26 feet above the ocean at that time, putting the French Quarter riverfront at around 14 feet above sea level, much closer to modern measurements.
Disruption came to the mapping sciences with the 1910s–1920s advent of aerial photography and photogrammetry, the science of extracting precise measurements from stereo aerial photographs. To standardize all the new data being generated with these technologies, the US Coast and Geodetic Survey established a system of twenty-six tidal gauges around North American coasts and fixed a theoretical plane among their distribution of sea-level measurements. This became known as the National Geodetic Vertical Datum of 1929 (NGVD1929), and for the next sixty years, elevation maps of coastal Louisiana and beyond usually referenced this baseline. NGVD1929 was superseded by the satellite-measured North American Vertical Datum of 1988, and both systems may be encountered today, depending on map vintage.
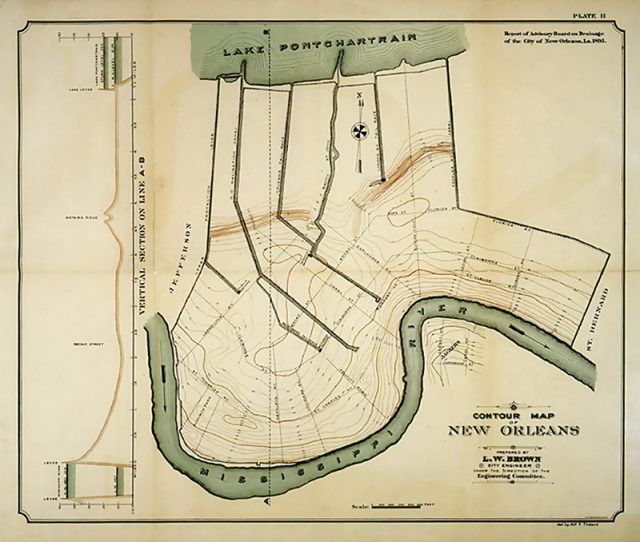
This 1895 elevation map of New Orleans by LW Brown and the Drainage Advisory Board, was the best of its time. Courtesy The Historic New Orleans Collection
Engineering and military applications have since grown so sophisticated that sea level, with all its global perturbations, no longer provides sufficient vertical control. So geodesists now peg global elevation measurements to the “ellipsoid,” a mathematical model describing the slightly oblate shape of the Earth, or the “geoid,” which accounts for gravitational pull. The height of any particular locale thus varies depending on whether it arises from the geoidal, ellipsoidal, or topographic surface, and if the latter, then the vertical datum underlying it.
Elevation Mapping in New Orleans
Except for site-level engineering blueprints, early maps of New Orleans usually communicated elevation through generalized hachures of dense canopy or murky morasses. Survey-grade elevation mapping did not arrive until the mid-1800s, starting with City Surveyor Louis H. Pilié’s drainage report of 1857. Twenty years later, what appears to be the earliest comprehensive elevation map of the city was produced by civil engineer T. S. Hardee and the New Orleans Auxiliary Sanitation Association. Hardee’s Topographical and Drainage Map of New Orleans and Surroundings, published in 1879 with one-foot contours likely derived from US Coast Survey Department data, represents a modification of the oft-reproduced 1878 “Hardee Map,” which does not depict elevation.
The next major attempt at topographic surveying came in 1893, by W. C. Kirkland and L. W. Brown of the Engineering Committee of the Drainage Advisory Board (DAB). The city had directed the DAB to design a major system to finally dry the streets and drain the backswamp. “First of all,” wrote the Board in its 1895 report, “it was necessary to have a topographic survey of the territory. . . . The information available [currently is] meagre, crude, and unreliable . . . to base upon it the design of so important. . . . Therefore as a necessary preliminary step, a complete survey was recommended.”
Because some benchmarks throughout the region have subsided, levees and gates may be inches or feet lower than presumed.
Over the next two years, DAB surveyors traversed forty-nine “carefully measured base lines around and within” the area bounded by the river, lake, Jefferson Parish line, and People’s Avenue, plus Algiers, totaling more than 150 linear miles. “The entire city has been leveled over, bench marks were established at convenient points, and a record of the location and elevation [were] registered [in reference to] the Cairo Datum,” the report stated. “The leveling consists [of] running each leading street and obtaining the elevation of the curb, gutter, center of street and property line at intersections, and in center of block, [plus] culverts, bridges and steam and street railroad tracks at intersections.”
From these field data, mapmakers compiled one-foot contours and plotted them at a scale of one inch to six hundred feet, producing ten large linen sheets. The resulting Topographical Map of New Orleans (1895), representing American engineering at its best conducted by native New Orleanians, would undergird one of the world’s great urban drainage systems. In subsequent decades, the 1895 DAB contours would be cited, copied, adapted, and modified until they were antiquated by aerial photogrammetry and better surveying tools, not to mention dramatic soil subsidence. The US Army Engineers conducted one such survey in 1935 and plotted the contours on standard 1:24,000 USGS quadrangles, which were later reissued and updated into modern times.
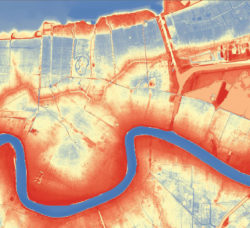
In 1994, the City Planning Commission contracted Vernon F. Meyer and Associates to conduct a first-ever full Global Positioning Systems (GPS) survey of New Orleans. Contours were compiled with unprecedented detail, showing practically every curb around every block, and were the first to be distributed only in digital format, as Geographic Information Systems (GIS) vectors, rather than as paper maps. Starting in 2000, the same company, working with the state and FEMA, captured LIDAR (Light Detection and Ranging) data for the most flood-prone parishes of Louisiana, including Orleans, to produce digital elevation models with unprecedented accuracy. This particular LIDAR sensor, mounted in an aircraft flying at eight thousand feet, emitted 15,000–30,000 laser pulses per second and recorded the exact location, time and direction of each pulse, as well as its bounce-back off surface features. From these raw data, analysts are able to compute the precise longitude, latitude, and elevation of millions of points on the land surface and interpolate them into a continuous surface. The FEMA LIDAR maps, which were reflown and updated in the 2010s, represent the most sophisticated and precise elevation mapping ever conducted in our region.

Mapping standards are relevant to Louisianans for a number of reasons. For one, coastal-area elevational ranges are so minute that every inch counts. The land surface is also dangerously eroding horizontally and subsiding vertically, in complex patterns that demand repeated fine-tuned measurement. Sea level, meanwhile, is rising at rates faster than it has been for millennia, making our elevation relative to the sea—and our vulnerability to hurricane-induced storm surges—that much more of a critical uncertainty. And because some benchmarks throughout the region have subsided, levees and gates may be inches or feet lower than presumed. All of these measurements affect risk, which in turn affects everything from flood insurance rates and economic viability to civil spirit and cultural sustainability.
Accurate topographic mapping is, in effect, the empirical link between the historical and future geography of our region. It represents both a local scientific achievement of which we should be proud and a challenge for which we should be prepared.
Richard Campanella, a geographer with the Tulane School of Architecture, is the author of Bienville’s Dilemma, Geographies of New Orleans, Bourbon Street: A History, Lincoln in New Orleans and other books. He may be reached through richcampanella.com, [email protected]; or @nolacampanella on Twitter.